The Deadliest Used Cars and Trucks on the Road

Contents
Introduction
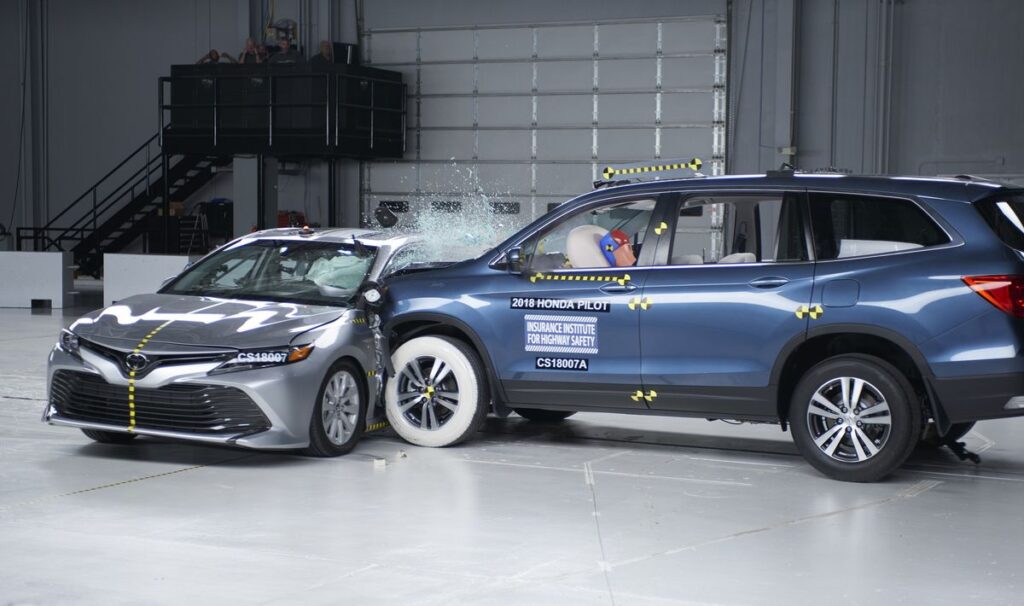
Car safety is a top priority for most buyers, especially when considering a used vehicle. While safety ratings and crash test results from organizations like the National Highway Traffic Safety Administration (NHTSA) and the Insurance Institute of Highway Safety (IIHS) are essential, real-world accident data can provide an invaluable perspective. This article delves into the models that, based on IIHS data, might raise a red flag for used car shoppers.
Methodology
The IIHS periodically calculates driver death rates for individual vehicle models. This data offers a unique perspective, highlighting the real-world safety of passenger vehicles across various size and class categories. The rates provided represent the number of driver deaths per million registered vehicle years. This metric looks at how many drivers die in a particular car model for every million years on the road.
It’s important to note that these rates account for only driver deaths, not passengers. The logic behind this is that every vehicle involved in a crash has a driver, but not necessarily passengers. To ensure accuracy, a vehicle must have at least 100,000 registered vehicle years or a minimum of 20 deaths within the four-year study period to be included in the analysis. The IIHS also considers earlier model years (up to three) if the vehicle wasn’t substantially redesigned during that period.
Moreover, death rates are adjusted for driver age and gender, and the data is derived from NHTSA’s Fatality Analysis Reporting System, combined with vehicle registrations from IHS Markit (now S&P Global).
The Deadliest Cars and Trucks
Here is our list broken out by popular vehicle types and their corresponding rates of driver deaths per million registered vehicles, according to IIHS.
Compact Cars
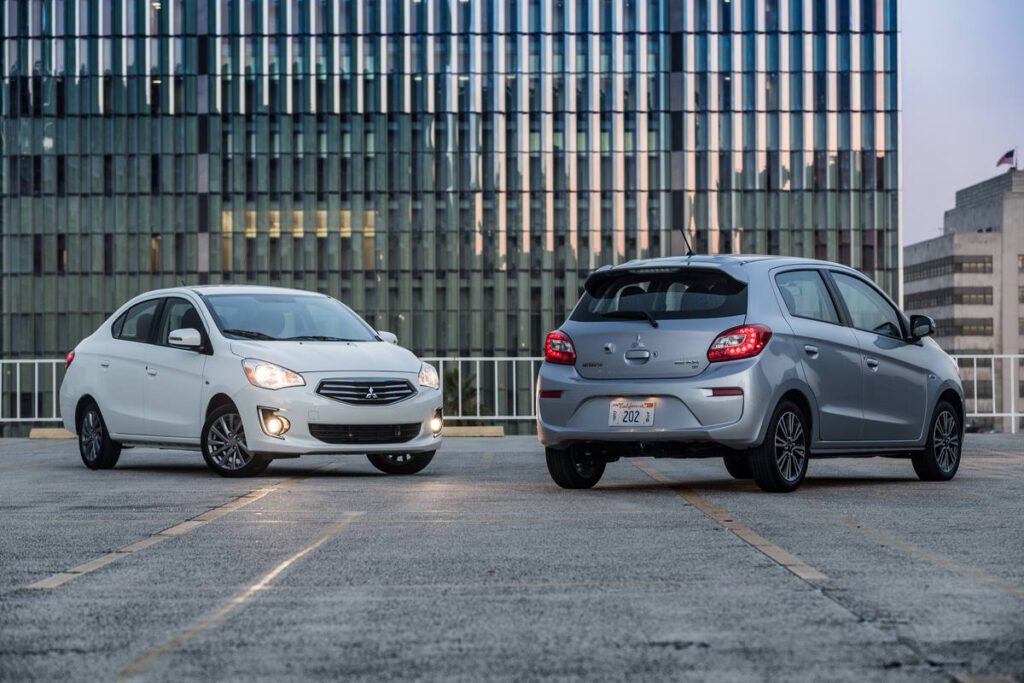
2018-2021 Mitsubishi Mirage (205 deaths per million)
Topping the list is the 2018-2021 Mirage G4 sedan, which recorded an astonishing 205 deaths per million registered vehicles — over five times the average for cars in its period. Unfortunately, the Mirage hatchback hasn’t fared much better at 482% higher than average.
2018-2021 Chevrolet Spark (151 deaths per million)
Another model from recent years to watch out for, the 2018-2021 Spark, recorded a death rate of 151, nearly four times higher than its contemporaries.
2009-2012 Kia Rio (149 deaths per million)
The 2009-2012 Kia Rio witnessed a death rate of 149 per million registered vehicles, well above the expected average.
2015-2018 Ford Fiesta (141 deaths per million)
Rounding off the compact car list, the Fiesta from 2015-2018 posted a death rate of 141, positioning it at almost four times the national average.
Sports Cars
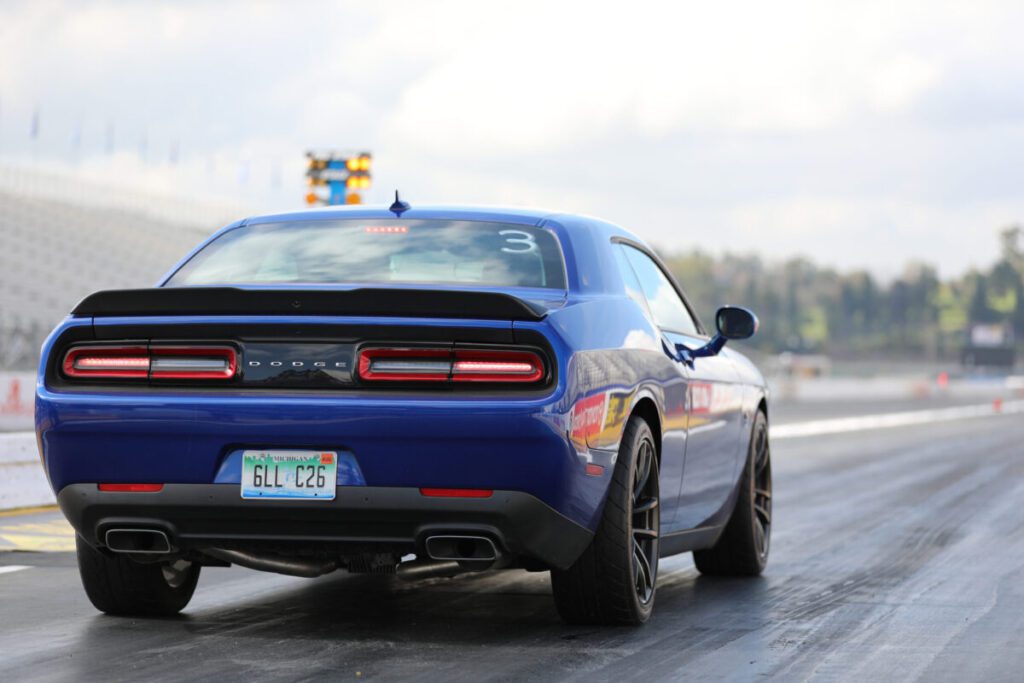
2018-2021 Dodge Challenger (154 deaths per million)
This muscle car, popular for its powerful performance, sadly logged 154 deaths per million registered vehicles for the 2018-2021 model years. This is a jarring 405% above the average, making it a significant outlier.
2018-2021 Chevrolet Camaro (110 deaths per million)
Another powerful car in this category, the 2018-2021 Camaro, recorded 110 deaths per million, approximately 289% above the average.
Midsize Sedans
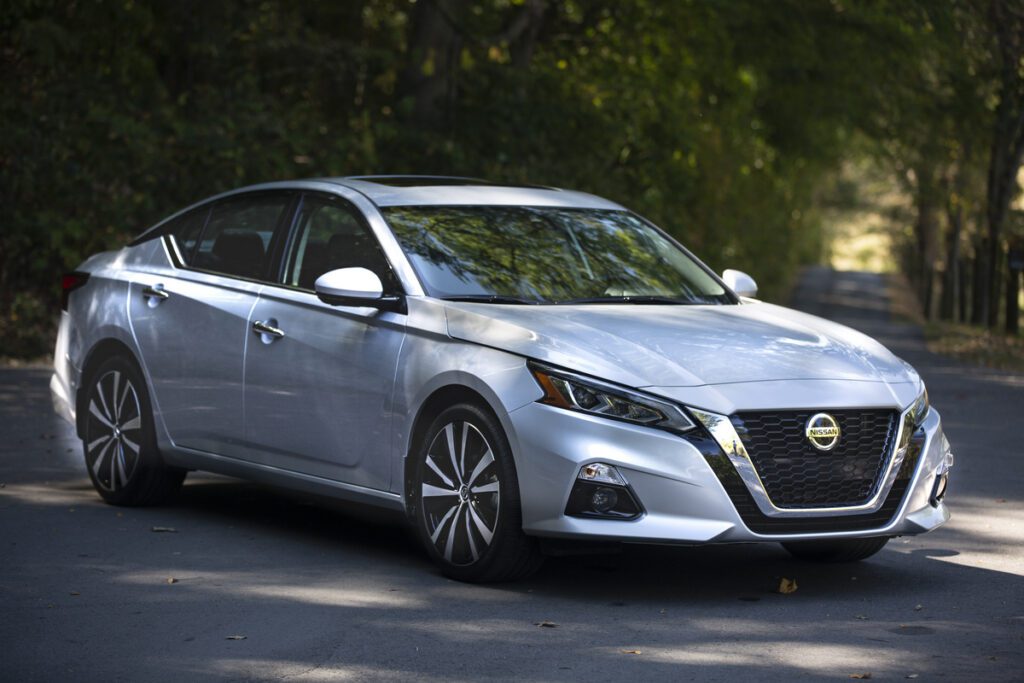
2018-2021 Nissan Altima (113 deaths per million)
The Altima, during this span, saw a fatality rate of 113. This figure means it had nearly three times the death rate compared to other cars from the same timeframe.
2018-2021 Chrysler 300 (100 deaths per million)
The luxury and style of the Chrysler 300 couldn’t eclipse its safety concerns. With 100 deaths per million, it stands at 263% above the average, demonstrating a tangible risk.
Pickup Trucks
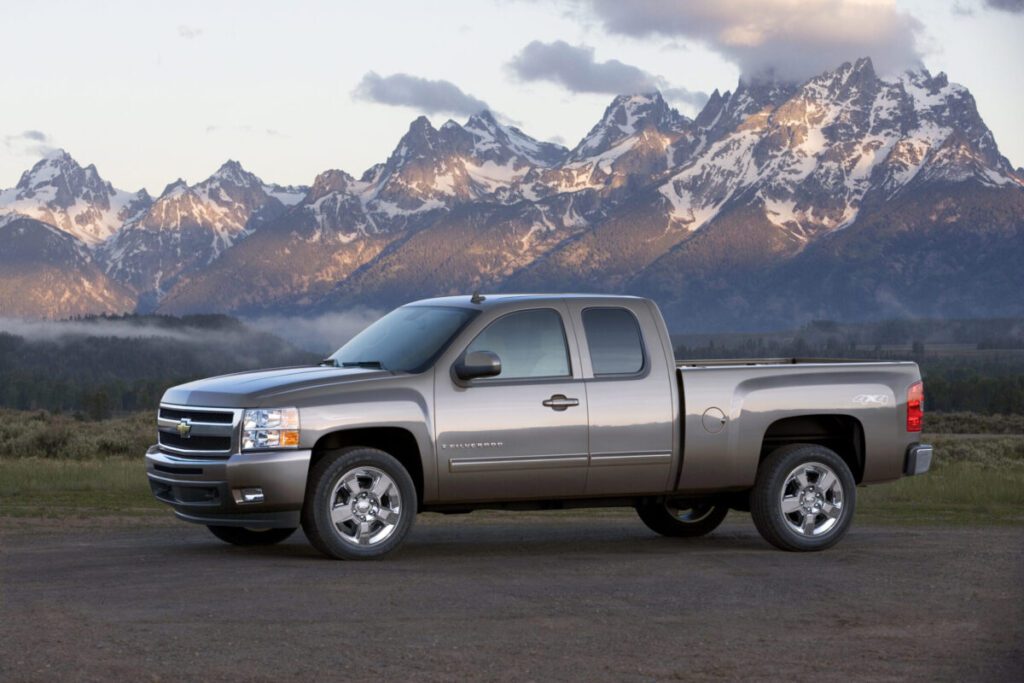
2009-2012 Chevrolet Silverado 1500 (79 deaths per million)
Unfortunately, the 2009-2012 Silverado pickup displayed a death rate of 79 per million registered vehicles. This is almost 282% above average.
2012-2015 Nissan Titan (73 deaths per million)
The 2012-2015 Titan recorded 73 deaths per million, according to IIHS data, outpacing the average by a considerable 243%.
A Deeper Look at the Numbers
When diving into the data, several patterns emerge that offer insights into vehicle safety across different segments. Compact sedans, for instance, make a significant appearance. Their smaller stature, by nature, can be at a disadvantage in collisions, lacking the robustness that larger vehicles might offer. To compound this, the affordability that attracts many to this segment might come at the cost of certain safety features or structural fortifications. As a result, while not all compact cars are inherently unsafe, older models in this category might warrant extra scrutiny from potential buyers.
Although less prevalent on the list than their compact counterparts, midsize cars still have a noticeable presence. This demonstrates that sheer size isn’t a guaranteed safety ticket. Numerous factors come into play, from the specific design and engineering of the car to the suite of safety features it boasts and even down to the typical driving behavior of those who choose particular models — which partially explains the two notable sports cars on the list.
The inclusion of trucks is somewhat unexpected. Given their bulk and structural advantage, they seem less susceptible to high fatality rates. However, while their deviation from the average is not as stark as some compact cars, it’s evident that no vehicle type is inherently exempt from safety concerns. The broader takeaway from the data might be that larger size offers some advantage in specific collision types. Still, other variables, such as design, tech features, and driver behavior, play pivotal roles.
It’s crucial to approach this data with a recognition of the ever-evolving landscape of vehicle safety. Manufacturers are in a constant cycle of design refinement fueled by real-world performance feedback and rapid advancements in safety technology. A particular make and model from a specific range of years might show concerning fatality rates. However, this doesn’t automatically cast a shadow on its successors or other contemporaneous vehicles from the same brand.

The Bottom Line
Being informed is paramount when navigating the used car market. This data serves as a guide, highlighting potential red flags. But remember, there are numerous safe, reliable options in every segment. It’s all about balancing what appeals to you and what keeps you safe on the road.
Photos courtesy of Chevrolet, Mitsubishi, Nissan, and Stellantis